Measuring a land plot is an important geodetic procedure. To obtain accurate numerical values, the measurement procedure should be performed by professional surveyors.
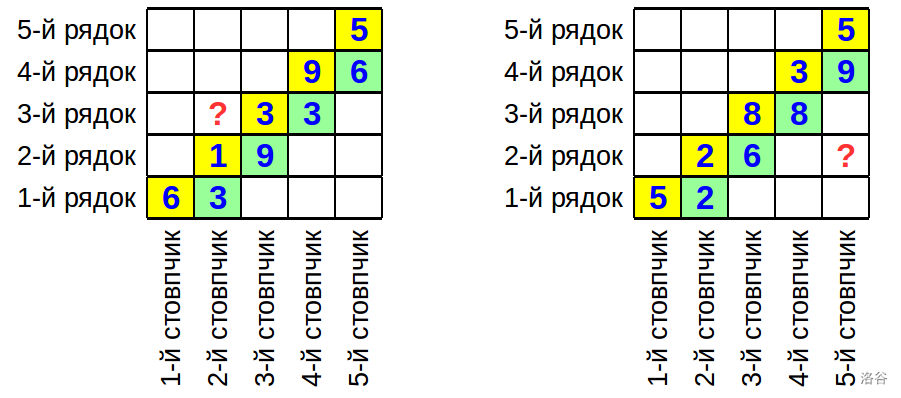
Let us consider the following problem. Let us assume that there is a square plot that surveyors have divided into rectangular plots by drawing vertical and horizontal lines. Let us number the rows and columns of the small plots as shown on the picture (the scale is not respected). That is, the rows are numbered from bottom to top by integer numbers from to ; and the columns are numbered from left to right by integer numbers from to .
The plots located at the intersection of the -th column and the -th row will be called the "main diagonal". The plots located at the intersection of the -th column and the -th row will be called the "side diagonal".
:::align{center}
 :::
:::
You know the areas of the plots on the main and side diagonals. Calculate the area of the plot at the intersection of the -th column and the -th row.
The first line contains an integer ().
The second line contains integers () --- the areas of the plots on the main diagonal.
The third line contains integers () --- the areas of the plots on the side diagonal.
The fourth line contains two integers and () --- the coordinates of the plot, the area of which should be calculated.
Output the area of the plot located at the intersection of the -th column and the -th row.
We want to know the exact value of the area, so the answer should be given in a factorized form. In other words, the answer should be represented as several lines, each containing two integers and : the number is necessarily prime, all are different, and the number is an integer and not equal to zero. The sought area must be equal to:
where is the number of lines in the answer. The lines must be sorted in increasing order of prime numbers . Recall that a number is considered prime if it has exactly two positive integer divisors: and .
If the required area is equal to 1, then output two units: .
5
6 1 3 9 5
3 9 3 6
2 3
3 -1
5
5 2 8 3 5
2 6 8 9
5 2
2 1
3 2
5
6 1 3 9 5
3 9 3 6
2 4
1 1
The area on the left in the figure corresponds to the first test from the condition. The area of the plot at the intersection of the 2nd column and the 3rd row is equal to:
The area on the right in the figure corresponds to the second test from the condition. The area of the plot at the intersection of the 5th column and the 2nd row is equal to:
