The ICPC (Incredibly Colossal and Particularly Comfortable) Theater is giving a number of traditional events to celebrate the New Year!
Each of the events has its own unalterable duration. Start times of the events are flexible as long as no two events overlap. An event may start immediately after another event ends.
Start times of the events influence the costs. The cost of an event is given by a continuous piecewise linear function (a polygonal line function) of its start time. Different events may have different cost functions.
You are asked to schedule all the events minimizing the total cost.
输入格式
The input consists of a single test case of the following format.
The first line contains an integer , representing the number of events. holds. The descriptions of the events follow. The description of the -th event, (), has the following format.
The integer in the first line is the number of vertices of the cost function of the event. The integer in the same line is the duration of the event. and hold.
The following lines describe the cost function. The -th line of the lines consists of the two integers and specifying the -th vertex of the cost function. and hold. In addition, is an integer for any .
The start time of the event must satisfy . For () satisfying , the cost of the event is given as .
The total number of the vertices of all the cost functions is not greater than 60.
输出格式
Output the minimum possible total cost of the events in a line.
It is guaranteed that there is at least one possible schedule containing no overlap. It can be proved that the answer is an integer.
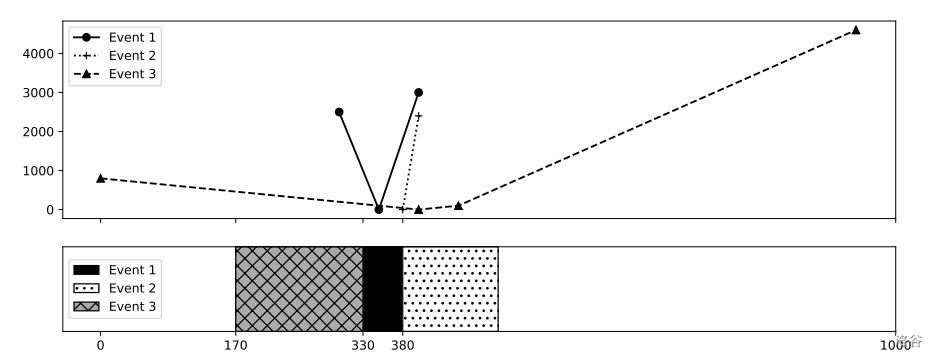
For Sample Input 1, making the (start time, end time) pairs of the three events to be , , and , respectively, achieves the minimum total cost without event overlaps. The cost of the event 1 is . Similarly, the costs of the events 2 and 3 are 0 and 460, respectively.
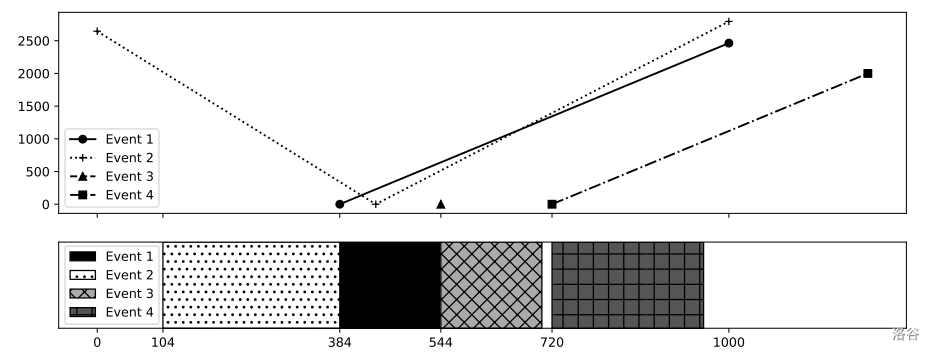
For Sample Input 2, the minimum cost is achieved by , , , and for the four events.
:::align{center}
Figure K.1. Cost functions in Sample Input 1 and a sample schedule
Figure K.2. Cost functions in Sample Input 2 and a sample schedule
:::
In Figures K.1 and K.2, polylines in the top figure represent cost functions, and rectangles in the bottom figure represent event durations of a schedule achieving the minimum total cost.