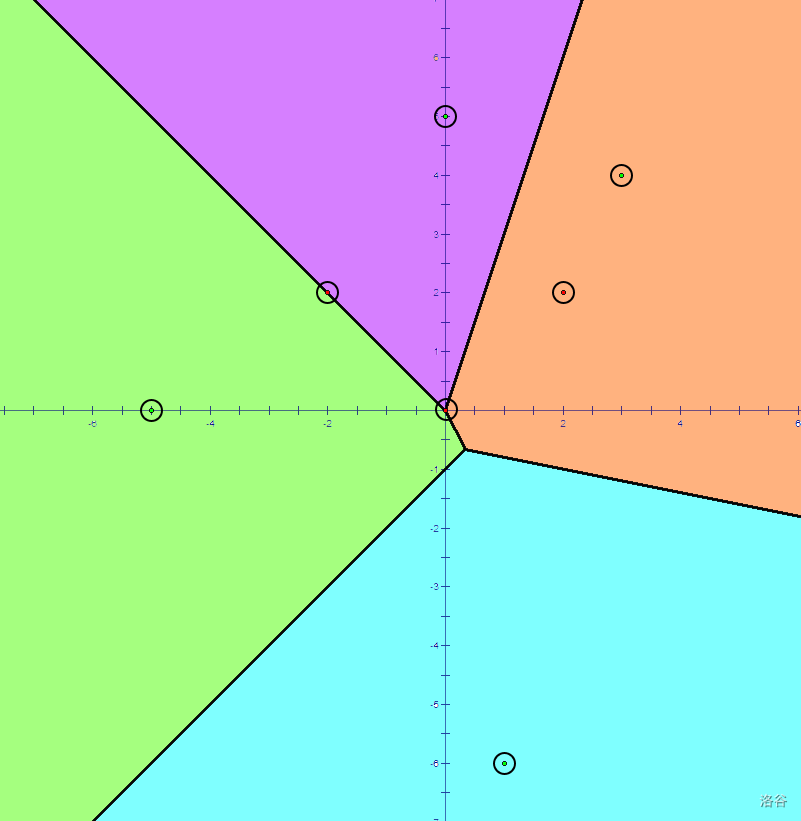
In the 2-dimensional Cartesian coordinate system, we define the of a non-empty
set of points , as a diagram that divides the plane by the criteria "which point in the set is closest in this location?". More precisely, the Voronoi diagram of a given non-empty point set is a collection of : A point is included in region if and only if holds for all , where denotes the Euclidean distance between point and .
For example, in the picture above, every location over the plane is colored by the closest point with such location. The points which belongs to a single region is colored by a light color indicating a region, and the points which belongs to more than one region forms lines and points colored black.
There is an algorithm which computes the Voronoi Diagram in , but it is infamous to be very complicated and hard. In fact, we are lenient problem setters, so we set , which means you can solve this task with slower Voronoi Diagram algorithms!
In this task, you should solve the in Voronoi diagram: in the Voronoi diagram constructed with the set of points , you should determine which region(s) the point belongs in. More precisely, you will be given queries of points. For each query point, you should determine the following:
If it's not included in any region, output .
If it's included in exactly one region, output , where is the index of such region.
If it's included in exactly two regions, output , where and ( ) are the indices of such two regions.
If it's included in three or more regions, output .
输入格式
In the first line, the number of points consisting Voronoi diagram , and the number of queries are given. ()
In the th line of next lines, two integers indicating and co-ordinate of are given. These are the points consisting the Voronoi diagram. All points are distinct. ()
In the th line of next lines, two integers indicating and co-ordinate of are given. For each point , you should determine in which region(s) the given point belongs to. ()
输出格式
Output consists of lines. In the th line, you should print one of following:
If is not included in any region, output .
If is included in exactly one region, output , where is the index of such region.
If is included in exactly two regions, output , where and ( ) are the indices of such two regions.